
In this tutorial, we are going to learn how to create a Graph in PHP using MySQL Database. phpChart is an amazing and simple to-utilize PHP outlining and diagramming segment for rendering responsive, intuitive, and information-driven Ajax HTML5 graphs.
Creating Database and same Data
in this step we are going to create MySQL Database and sample data to show in graph.
1-Creating Database
- Open PHPMyAdmin in your Browser
- Click on Database Tab Display on Topside
- Give the Database name “graph”.
- After Creating Database Open it.
- Click on SQL Tab on Top area
- Copy the Below Source Code and paste it.
- Then Click on Go.
-- phpMyAdmin SQL Dump
-- version 4.8.4
-- https://www.phpmyadmin.net/
--
-- Host: 127.0.0.1
-- Generation Time: Dec 26, 2018 at 08:39 PM
-- Server version: 10.1.37-MariaDB
-- PHP Version: 7.3.0

SET SQL_MODE = "NO_AUTO_VALUE_ON_ZERO";
SET AUTOCOMMIT = 0;
START TRANSACTION;
SET time_zone = "+00:00";


/*!40101 SET @OLD_CHARACTER_SET_CLIENT=@@CHARACTER_SET_CLIENT */;
/*!40101 SET @OLD_CHARACTER_SET_RESULTS=@@CHARACTER_SET_RESULTS */;
/*!40101 SET @OLD_COLLATION_CONNECTION=@@COLLATION_CONNECTION */;
/*!40101 SET NAMES utf8mb4 */;

--
-- Database: `graph`
--

-- --------------------------------------------------------

--
-- Table structure for table `tblsales`
--

CREATE TABLE `tblsales` (
  `SalesId` int(11) NOT NULL,
  `Product` varchar(90) NOT NULL,
  `TotalSales` double NOT NULL
) ENGINE=InnoDB DEFAULT CHARSET=latin1;

--
-- Dumping data for table `tblsales`
--

INSERT INTO `tblsales` (`SalesId`, `Product`, `TotalSales`) VALUES
(1, 'Mouse', 5000),
(2, 'Keyboard', 7000),
(3, 'Desktop', 3000),
(4, 'Mobile', 8030);

--
-- Indexes for dumped tables
--

--
-- Indexes for table `tblsales`
--
ALTER TABLE `tblsales`
  ADD PRIMARY KEY (`SalesId`);

--
-- AUTO_INCREMENT for dumped tables
--

--
-- AUTO_INCREMENT for table `tblsales`
--
ALTER TABLE `tblsales`
  MODIFY `SalesId` int(11) NOT NULL AUTO_INCREMENT, AUTO_INCREMENT=6;
COMMIT;

/*!40101 SET CHARACTER_SET_CLIENT=@OLD_CHARACTER_SET_CLIENT */;
/*!40101 SET CHARACTER_SET_RESULTS=@OLD_CHARACTER_SET_RESULTS */;
/*!40101 SET COLLATION_CONNECTION=@OLD_COLLATION_CONNECTION */;
OR Import DB File
After Downloading the source code extract it in your root folder.
- Open PHPMyAdmin in your Browser
- Click on Database Tab Display on Top side
- Give the Database name “ang-crud”.
- After Creating Database Open it.
- Click on Import Tab on Top area
- You can Find Db file in Downloaded source code Select it.
- Then Click on Go.
2- Creating Database Connection and fetch data from database
After import Database File then next step is creating database connection and fetch data from MySQL Database using PHP copy the below code and save it is as “record.php”.
<?php
$con  = mysqli_connect("localhost","root","","graph");
 if (!$con) {
     # code...
    echo "Problem in database connection! Contact administrator!" . mysqli_error();
 }else{
         $sql ="SELECT * FROM tblsales";
         $result = mysqli_query($con,$sql);
         $chart_data="";
         while ($row = mysqli_fetch_array($result)) {

            $productname[]  = $row['Product']  ;
            $sales[] = $row['TotalSales'];
        }

 }
?>
3-Creating Index Page
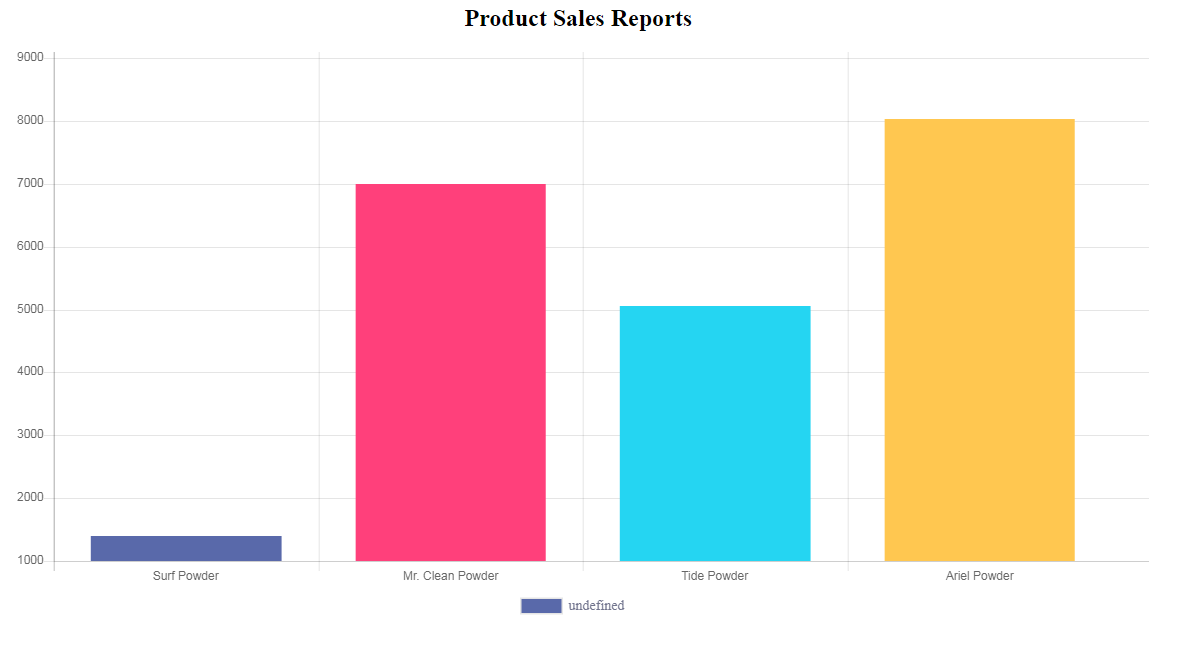
in this step we are going to create index page where create JavaScript code to show database data in a graph. here the source code. and save it as index.php.
<?php require_once 'record.php'; ?>
<!DOCTYPE html>
<html lang="en">
    <head>
        <meta http-equiv="Content-Type" content="text/html; charset=utf-8" />
        <meta name="viewport" content="width=device-width, initial-scale=1.0">
        <title>Graph</title>
    </head>
    <body>
        <div style="width:60%;hieght:20%;text-align:center">
            <h2 class="page-header" >Product Sales Reports </h2>
            <p style="align:center;"><canvas  id="chartjs_bar"></canvas></p>
        </div>
    </body>
  <script src="js/jquery.js"></script>
  <script src="js/Chart.min.js"></script>
<script type="text/javascript">
      var ctx = document.getElementById("chartjs_bar").getContext('2d');
                var myChart = new Chart(ctx, {
                    type: 'bar',
                    data: {
                        labels:<?php echo json_encode($productname); ?>,
                        datasets: [{
                            backgroundColor: [
                               "#5969aa",
                                "#ff407b",
                                "#331523",
                                "#ffc750"
                            ],
                            data:<?php echo json_encode($sales); ?>,
                        }]
                    },
                    options: {
                           legend: {
                        display: true,
                        position: 'bottom',

                        labels: {
                            fontColor: '#71748d',
                            fontFamily: 'Circular Std Book',
                            fontSize: 14,
                        }
                    },


                }
                });
    </script>
</html>
If you facing any type of problem with this source code then you can Download the Complete source code in zip Formate by clicking the below button Download Now otherwise you can send Comment.
Works beautifully. Thanks.
How to add more fields to chart ?
you can add from mysql database